NDPluginStats
- author:
Mark Rivers, University of Chicago
Overview
NDPluginStats computes the following.
Basic statistics: minimum, maximum, mean, sigma, total, and net (background subtracted).
Centroid, sigma, skewness and kurtosis values in the X and Y dimensions.
Profiles of the array in the X and Y dimensions. A total of 8 profiles are calculated:
The average profiles in the X and Y directions.
The average profiles in the X and Y directions, for array elements greater than the centroid threshold.
The profiles in the X and Y directions at the X and Y centroid position.
The profiles in the X and Y directions at a user-defined X and Y cursor position.
A histogram of the values (e.g. number of pixels versus intensity per pixel).
Each calculcation can be independently enabled and disabled. Calculations 1 and 4 can be perfomed on arrays of any dimension. Calculations 2 and 3 are restricted to 2-D arrays.
Time-series arrays of the basic statistics, centroid and sigma statistics can also be collected. This is very useful for on-the-fly data acquisition, where the NDStats plugin computes the net or total counts in the detector or an ROI. It can also be used to quickly plot a time-history of beam position or width, etc. The time series can also be used in a circular buffer mode where is continuously displays the last N values of the statistic.
NDPluginStats inherits from NDPluginDriver. The NDPluginStats class documentation describes this class in detail.
NDPluginStats.h defines the following parameters. It also implements all
of the standard plugin parameters from
NDPluginDriver. The EPICS database
NDStats.template provide access to these parameters, listed in the
following table. Note that to reduce the width of this table the
parameter index variable names have been split into 2 lines, but these
are just a single name, for example NDPluginStatsComputeStatistics.
Parameter Definitions in NDPluginStats.h and EPICS Record Definitions in NDStats.template |
||||||
|---|---|---|---|---|---|---|
Parameter index variable |
asyn interface |
Access |
Description |
drvInfo string |
EPICS record name |
EPICS record type |
Basic statistics |
||||||
NDPluginStats |
asynInt32 |
r/w |
Flag to control whether to compute statistics for this array (0=No, 1=Yes). Not computing statistics reduces CPU load. Basic statistics computations are quite fast, since they involve mostly double precision addition, with 1 multiply to compute sigma, per array element. |
COMPUTE_STATISTICS |
$(P)$(R)ComputeStatistics, $(P)$(R)ComputeStatistics_RBV |
bo, bi |
NDPluginStats |
asynInt32 |
r/w |
Width of the background in pixels to use when computing net counts. 0=no background subtraction, so the net counts is the same as the total counts. |
BGD_WIDTH |
$(P)$(R)BgdWidth, $(P)$(R)BgdWidth_RBV |
longout, longin |
NDPluginStats |
asynFloat64 |
r/o |
Minimum value in any element in the array |
MIN_VALUE |
$(P)$(R)MinValue_RBV |
ai |
NDPluginStats |
asynFloat64 |
r/o |
X pixel location of minimum value in the array. This is only valid for 2-D monochromatic arrays. |
MIN_X |
$(P)$(R)MinX_RBV |
ai |
NDPluginStats |
asynFloat64 |
r/o |
Y pixel location of minimum value in the array. This is only valid for 2-D monochromatic arrays. |
MIN_Y |
$(P)$(R)MinY_RBV |
ai |
NDPluginStats |
asynFloat64 |
r/o |
Maximum value in any element in the array |
MAX_VALUE |
$(P)$(R)MaxValue_RBV |
ai |
NDPluginStats |
asynFloat64 |
r/o |
X pixel location of maximum value in the array. This is only valid for 2-D monochromatic arrays. |
MAX_X |
$(P)$(R)MaxX_RBV |
ai |
NDPluginStats |
asynFloat64 |
r/o |
Y pixel location of maximum value in the array. This is only valid for 2-D monochromatic arrays. |
MAX_Y |
$(P)$(R)MaxY_RBV |
ai |
NDPluginStats |
asynFloat64 |
r/o |
Mean value in the array |
MEAN_VALUE |
$(P)$(R)MeanValue_RBV |
ai |
NDPluginStats |
asynFloat64 |
r/o |
Sum (total) of all elements in the array. This is available as an ai record. The total counts are also available as epicsInt32 values in an mca record via callbacks to the drvFastSweep driver. The mca record is very useful for on-the-fly data acquisition of the total counts in the detector or in an ROI. |
TOTAL |
$(P)$(R)Total_RBV, $(P)$(R)TotalArray |
ai, mca |
NDPluginStats |
asynFloat64 |
r/o |
Net (background subtracted) total of all elements in the array. The background is calculated by determining the average counts per array element in a border around the array of width NDPluginStatsBgdWidth. This average background counts per element is then subtracted from all elements inside the array. If NDPluginStatsBgdWidth is ≤ 0 then no background is computed. The net counts is available as an ai record. The net counts is also available as epicsInt32 values in an mca record via callbacks to the drvFastSweep driver. The mca record is very useful for on-the-fly data acquisition of the net counts in the detector or in an ROI. |
NET |
$(P)$(R)Net_RBV, $(P)$(R)NetArray |
ai, mca |
NDPluginStats |
asynFloat64 |
r/o |
Sigma (standard deviation) of all elements in the array |
SIGMA_VALUE |
$(P)$(R)Sigma_RBV |
ai |
Centroid statistics |
||||||
NDPluginStats |
asynInt32 |
r/w |
Flag to control whether to compute the centroid statistics (0=No, 1=Yes). The centroids are computed from the average row and column profiles above the centroid threshold. These calculations are also quite fast, since they just involve addition operations for each array element. |
COMPUTE_CENTROID |
$(P)$(R)ComputeCentroid, $(P)$(R)ComputeCentroid_RBV |
bo, bi |
NDPluginStats |
asynFloat64 |
r/w |
Threshold used when computing the centroid statistics. All array elements less than this value are set to 0 for computing the centroid statistics. It is important to set this value to ignore the “background” when computing the position and size of a “beam” image, for example. |
CENTROID_THRESHOLD |
$(P)$(R)CentroidThreshold, $(P)$(R)CentroidThreshold_RBV |
ao, ai |
NDPluginStats |
asynFloat64 |
r/o |
Total mass, sum of all elements above the threshold. |
CENTROID_TOTAL |
$(P)$(R)CentroidTotal_RBV |
ai |
NDPluginStats |
asynFloat64 |
r/o |
X centroid of the array above the centroid threshold. |
CENTROIDX_VALUE |
$(P)$(R)CentroidX_RBV |
ai |
NDPluginStats |
asynFloat64 |
r/o |
Y centroid of the array above the centroid threshold. |
CENTROIDY_VALUE |
$(P)$(R)CentroidY_RBV |
ai |
NDPluginStats |
asynFloat64 |
r/o |
Sigma X (width) of the distribution above the centroid threshold. |
SIGMAX_VALUE |
$(P)$(R)SigmaX_RBV |
ai |
NDPluginStats |
asynFloat64 |
r/o |
Sigma Y (height) of the distribution above the centroid threshold. |
SIGMAY_VALUE |
$(P)$(R)SigmaY_RBV |
ai |
NDPluginStats |
asynFloat64 |
r/o |
This is the normalized value of sigmaXY, i.e. sigmaXY/(sigmaX * sigmaY). This is often called the correlation coefficient, r. It is zero if the X and Y profiles are not correlated, meaning that the distribution is not tilted with respect to the X and Y axes. |
SIGMAXY_VALUE |
$(P)$(R)SigmaXY_RBV |
ai |
NDPluginStats |
asynFloat64 |
r/o |
Skewness X (symmetry) of the distribution above the centroid threshold, in relation
to the center of mass. |
SKEWX_VALUE |
$(P)$(R)SkewX_RBV |
ai |
NDPluginStats |
asynFloat64 |
r/o |
Skewness Y (symmetry) of the distribution above the centroid threshold, in relation
to the center of mass. |
SKEWY_VALUE |
$(P)$(R)SkewY_RBV |
ai |
NDPluginStats |
asynFloat64 |
r/o |
Excess Kurtosis X (flatness) of the distribution above the centroid threshold |
KURTOSISX_VALUE |
$(P)$(R)KurtosisX_RBV |
ai |
NDPluginStats |
asynFloat64 |
r/o |
Excess Kurtosis Y (flatness) of the distribution above the centroid threshold. |
KURTOSISY_VALUE |
$(P)$(R)KurtosisY_RBV |
ai |
NDPluginStats |
asynFloat64 |
r/o |
Eccentricity, can take values from 0 to 1. 0 means a perfectly round object and 1 mean a line shaped object. |
ECCENTRICITY_VALUE |
$(P)$(R)Eccentricity_RBV |
ai |
NDPluginStats |
asynFloat64 |
r/o |
Orientation of the object, orientation of the “long” direction with respect to horizontal (x axis). |
ORIENTATION_VALUE |
$(P)$(R)Orientation_RBV |
ai |
Time-Series data |
||||||
The time series is implemented by loading an instance of the NDPluginTimeSeries
plugin for each NDPluginStats plugin, and the time series control
uses records in NDTimeSeries.template. That documentation should be consulted for
an explanation of these records. The prefix and record name macro for the time-series
plugin records from NDTimeSeries.template is $(P)$(R)TS:. |
||||||
NDPluginTimeSeries, TSTimeSeries |
asynFloat64Array |
r/o |
The time series data arrays of the basic statistics and centroid and sigma statistics described above. |
TS_TIME_SERIES |
$(P)$(R)XXX, where XXX is: |
waveform |
X and Y Profiles |
||||||
NDPluginStats |
asynInt32 |
r/w |
Flag to control whether to compute the profiles for this array (0=No, 1=Yes). |
COMPUTE_PROFILES |
$(P)$(R)ComputeProfiles, $(P)$(R)ComputeProfiles_RBV |
bo, bi |
NDPluginStats |
asynInt32 |
r/o |
Number of array elements in the X profiles. |
PROFILE_SIZE_X |
$(P)$(R)ProfileSizeX_RBV |
longin |
NDPluginStats |
asynInt32 |
r/o |
Number of array elements in the Y profiles. |
PROFILE_SIZE_Y |
$(P)$(R)ProfileSizeY_RBV |
longin |
NDPluginStats |
asynInt32 |
r/w |
X position of a user-defined cursor for profiles. |
CURSOR_X |
$(P)$(R)CursorX, $(P)$(R)CursorX_RBV |
longout, longin |
NDPluginStats |
asynInt32 |
r/w |
Y position of a user-defined cursor for profiles. |
CURSOR_Y |
$(P)$(R)CursorY, $(P)$(R)CursorY_RBV |
longout, longin |
NDPluginStats |
asynFloat64 |
r/o |
Value of the pixel at the current cursor position. |
CURSOR_VAL |
$(P)$(R)CursorVal |
ai |
NDPluginStats |
asynFloat64Array |
r/o |
Profile of the average row in the array, i.e. the sum of all rows in the array divided by the number of rows. |
PROFILE_AVERAGE_X |
$(P)$(R)ProfileAverageX_RBV |
waveform |
NDPluginStats |
asynFloat64Array |
r/o |
Profile of the average column in the array, i.e. the sum of all columns in the array divided by the number of columns. |
PROFILE_AVERAGE_Y |
$(P)$(R)ProfileAverageY_RBV |
waveform |
NDPluginStats |
asynFloat64Array |
r/o |
Same as ProfileAverageX except that all array elements less than CentroidThreshold are set to zero when computing the average. |
PROFILE_THRESHOLD_X |
$(P)$(R)ProfileThresholdX_RBV |
waveform |
NDPluginStats |
asynFloat64Array |
r/o |
Same as ProfileAverageY except that all array elements less than CentroidThreshold are set to zero when computing the average. |
PROFILE_THRESHOLD_Y |
$(P)$(R)ProfileThresholdY_RBV |
waveform |
NDPluginStats |
asynFloat64Array |
r/o |
X profile through the array in the row defined by CentroidY. |
PROFILE_CENTROID_X |
$(P)$(R)ProfileCentroidX_RBV |
waveform |
NDPluginStats |
asynFloat64Array |
r/o |
Y profile through the array in the column defined by CentroidX. |
PROFILE_CENTROID_Y |
$(P)$(R)ProfileCentroidY_RBV |
waveform |
NDPluginStats |
asynFloat64Array |
r/o |
X profile through the array in the row defined by CursorY. |
PROFILE_CURSOR_X |
$(P)$(R)ProfileCursorX_RBV |
waveform |
NDPluginStats |
asynFloat64Array |
r/o |
Y profile through the array in the row defined by CursorX. |
PROFILE_CURSOR_Y |
$(P)$(R)ProfileCursorY_RBV |
waveform |
Array histogram |
||||||
NDPluginStats |
asynInt32 |
r/w |
Flag to control whether to compute the histogram for this array (0=No, 1=Yes). Not computing the histogram reduces CPU load. |
COMPUTE_HISTOGRAM |
$(P)$(R)ComputeHistogram, $(P)$(R)ComputeHistogram_RBV |
bo, bi |
NDPluginStats |
asynInt32 |
r/w |
Number of elements (bins) in the histogram |
HIST_SIZE |
$(P)$(R)HistSize, $(P)$(R)HistSize_RBV |
longout, longin |
NDPluginStats |
asynFloat64 |
r/w |
Minimum value for the histogram. All values less than this will be counted in HistBelow. |
HIST_MIN |
$(P)$(R)HistMin, $(P)$(R)HistMin_RBV |
ao, ai |
NDPluginStats |
asynFloat64 |
r/w |
Maximum value for the histogram. All values greater than this will be counted in HistAbove. |
HIST_MAX |
$(P)$(R)HistMax, $(P)$(R)HistMax_RBV |
ao, ai |
NDPluginStats |
asynInt32 |
r/o |
Count of all values less than HistMin. |
HIST_BELOW |
$(P)$(R)HistBelow_RBV |
longin |
NDPluginStats |
asynInt32 |
r/o |
Count of all values greater than HistMax. |
HIST_ABOVE |
$(P)$(R)HistAbove_RBV |
longin |
NDPluginStats |
asynFloat64 |
r/o |
Entropy of the image. This is a measure of the sharpness of the histogram, and is often a useful figure of merit for determining sharpness of focus, etc. It is defined as -SUM(BIN[i]*log(BIN[i]), where the sum is over the number of bins in the histogram and BIN[i] is the number of elements in bin i. |
HIST_ENTROPY |
$(P)$(R)HistEntropy_RBV |
ai |
NDPluginStats |
asynFloat64Array |
r/o |
Histogram array, i.e. counts in each histogram bin. |
HIST_ARRAY |
$(P)$(R)Histogram_RBV |
waveform |
NDPluginStats |
asynFloat64Array |
r/o |
Histogram X-axis array, i.e. minimum intensity in each histogram bin. |
HIST_X_ARRAY |
$(P)$(R)HistogramX_RBV |
waveform |
If the values of CentroidThreshold, CursorX, or CursorY are changed then the centroid and profile calculations are performed again immediately on the last array collected. Thus updated centroid statistics and profiles can be displayed even when new arrays are not being acquired. These calculations are only performed when enabled by ComputeCentroid and ComputeProfiles.
Configuration
The NDPluginStats plugin is created with the NDStatsConfigure command, either from C/C++ or from the EPICS IOC shell.
NDStatsConfigure(const char *portName, int queueSize, int blockingCallbacks,
               const char *NDArrayPort, int NDArrayAddr,
               int maxBuffers, size_t maxMemory,
               int priority, int stackSize)
For details on the meaning of the parameters to this function refer to the detailed documentation on the NDStatsConfigure function in the NDPluginStats.cpp documentation and in the documentation for the constructor for the NDPluginStats class.
Screen shots
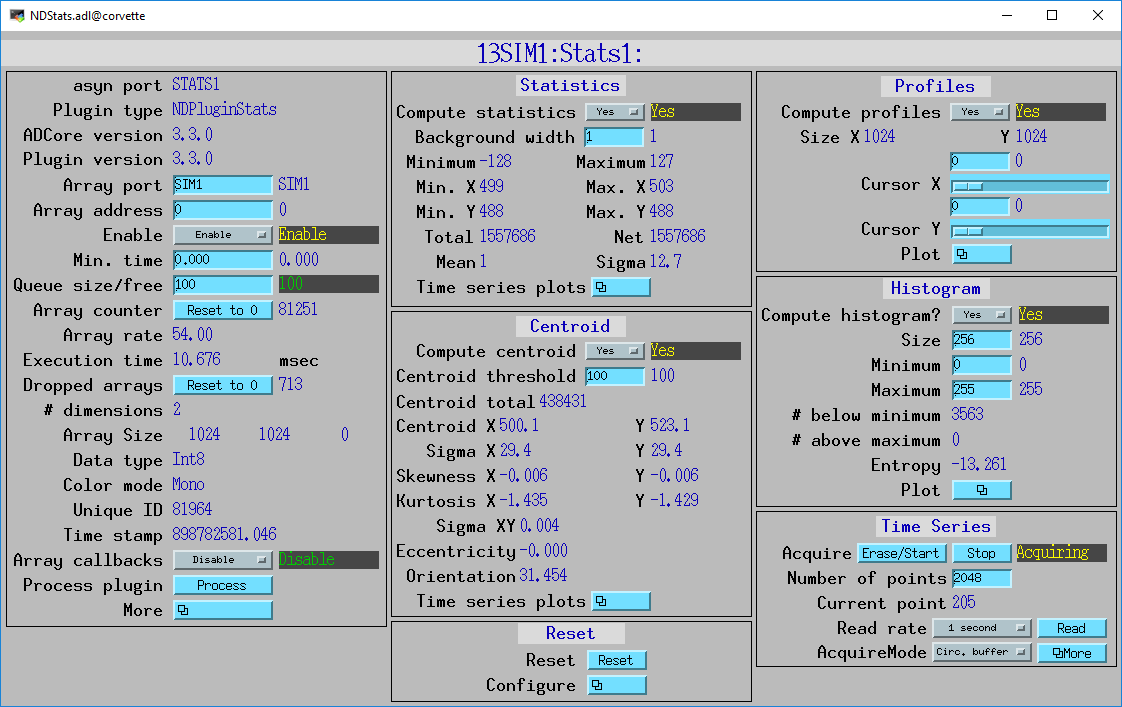
The following MEDM screen provides access to the parameters in NDPluginDriver.h and NDPluginStats.h through records in NDPluginBase.template and NDStats.template.
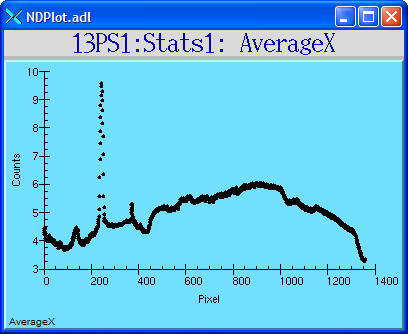
The following MEDM screen shows the average profile of an image in the X direction.
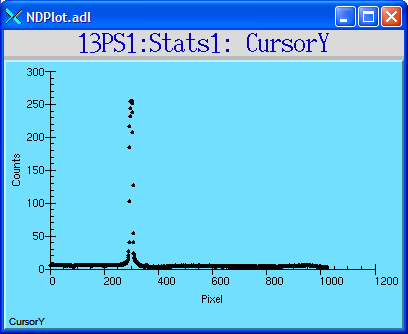
The following MEDM screen shows the profile of an image in the Y direction at the location of the user-defined cursor.
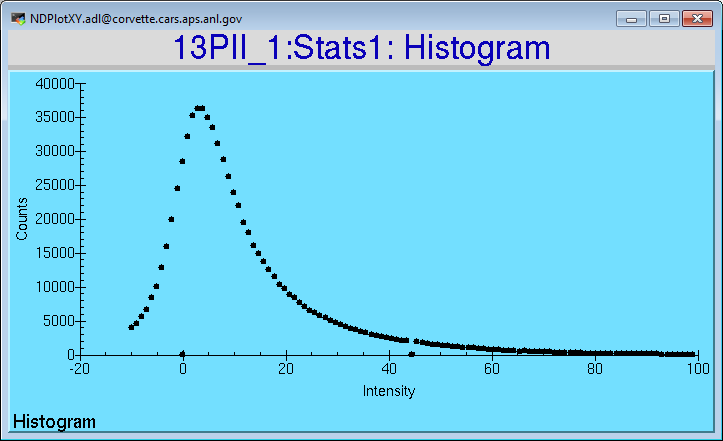
The following MEDM screen shows the histogram of intensities of an array.
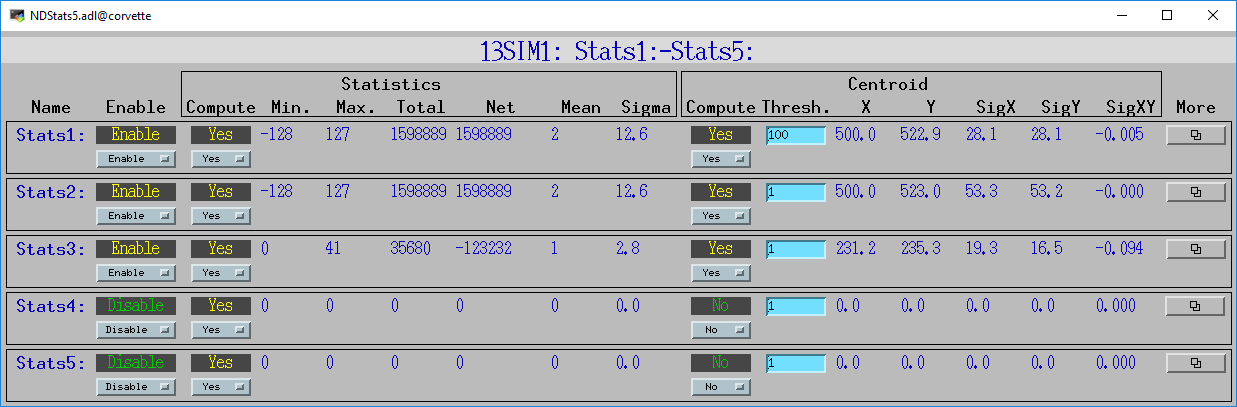
The following MEDM screen combines many parameters for 5 NDPluginStats plugins on a single screen.
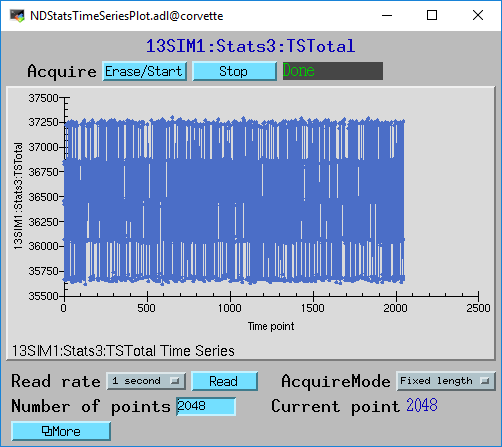
The following MEDM screen shows the the total counts from the Stats1 plugin. This is the total counts as a function of time.
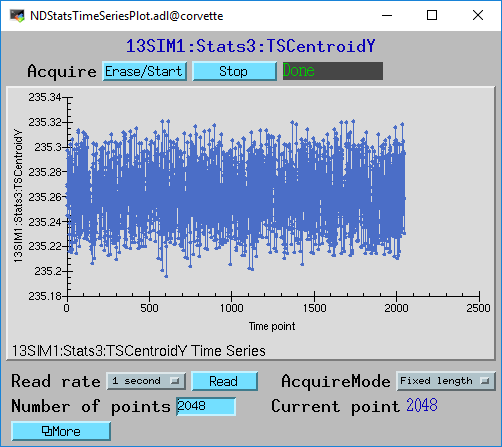
The following MEDM screen shows the Y centroid as a function of time from the Stats1 plugin.
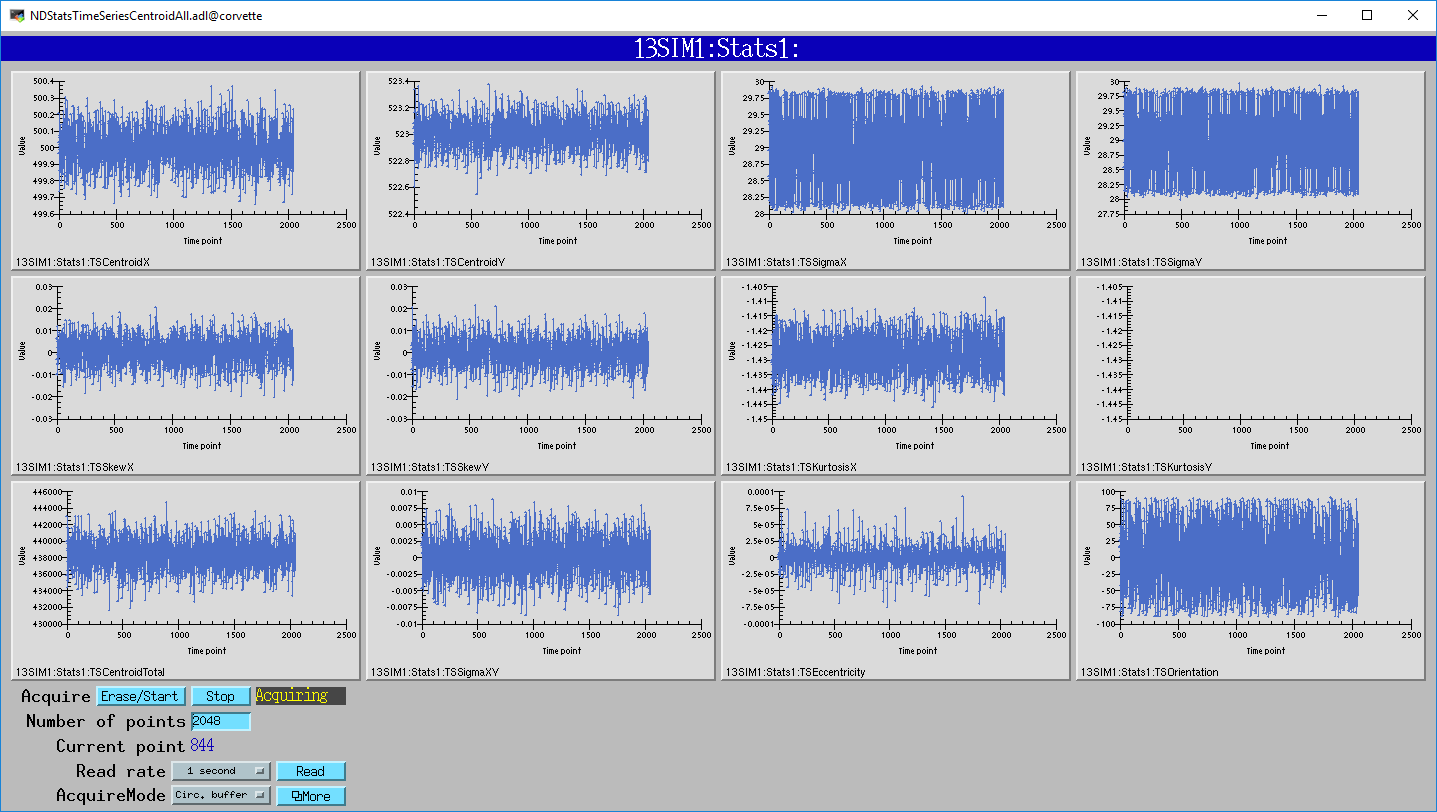
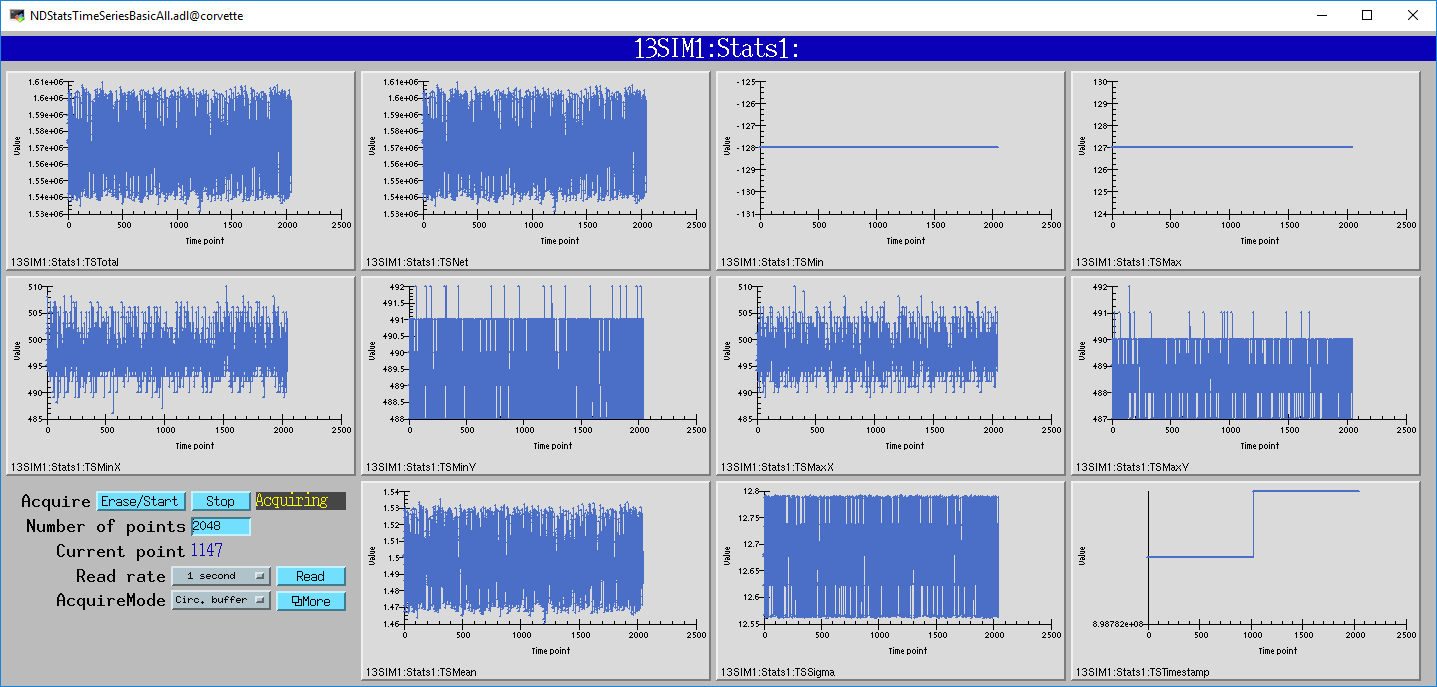
The following MEDM screen shows all of the basic statistics as a function of time from the Stats1 plugin.
The following MEDM screen shows all of the centroid statistics as a function of time from the Stats1 plugin.